sorted by: new top controversial old
[-] LabPlot@floss.social 12 points 9 months ago

@nikoof

Our Christmas tree includes a test to check if our readers are humans 😉

[-] LabPlot@floss.social 21 points 9 months ago

@zkfcfbzr @opensource

Let's just assume that the Christmas tree includes a test to check if our readers are humans 🙂

293
submitted 9 months ago* (last edited 9 months ago) by LabPlot@floss.social to c/opensource@lemmy.ml

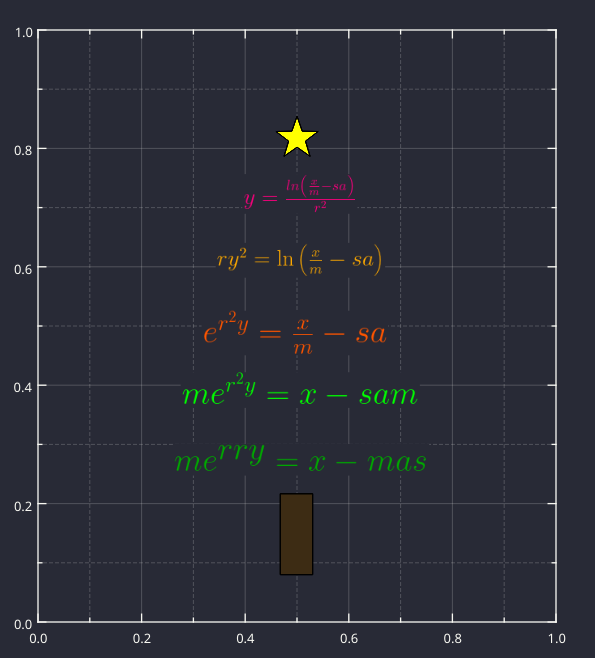
Merry Christmas from the LabPlot team! 🎅 🎄

@opensource @kde
#Christmas #FOSS #FLOSS #OpenSource #KDE #LabPlot #DataScience #DataViz

[-] LabPlot@floss.social -2 points 1 year ago* (last edited 1 year ago)

@Hazdaz @science

Is the act of distinguishing a question from an answer as difficult as recognizing spurious correlations?

The question has been raised earlier by others,. See for example this paper from 2021 (Measuring the effect of energy consumption on the epidemic
of overweight in Latin America and Caribbean countries):

https://dialnet.unirioja.es/descarga/articulo/8100043.pdf

[-] LabPlot@floss.social 0 points 1 year ago

@edwiebe @science

If you are interested, please see also this thread on the importance of visualizing data (the Anscombe's quartet, Simpson's paradox are also included in @LabPlot):

https://mstdn.social/@onemoment/109692198312380103

#Anscombe #SimpsonsParadox #DatasaurusDozen #Visualization #DataViz

[-] LabPlot@floss.social -1 points 1 year ago* (last edited 1 year ago)

@edwiebe @science

We agree. But still, a question is just a question, and you can always refine your questions.

Matejka, J., & Fitzmaurice, G. (2017). Same Stats, Different Graphs: Generating Datasets with Varied Appearance and Identical Statistics through Simulated Annealing.

BTW, the Datasaurus Dozen example is already available in @LabPlot via File > Open Example.

[-] LabPlot@floss.social -1 points 1 year ago

@Spuddaccino

For example: Tonga, Samoa, Kiribati, Nauru with electricity consumption per capita (the median) 548 kWh.

-22
submitted 1 year ago* (last edited 1 year ago) by LabPlot@floss.social to c/science@lemmy.world

Is there a causal relationship between electricity consumption and obesity, or is it just an illusory correlation❓

@science @dataisbeautiful @health

The plot and curve fitting made in @LabPlot, a FREE, open source Data Visualization and Analysis software. It works on #Windows, #Linux and #macOS.

➡️ https://labplot.kde.org/download

#Data compiled for 184 countries.

#FOSS #FLOSS #OpenSource #FreeSoftware #DataViz #Visualization #Obesity #Health #ClimateChange #ClimateCrisis #Climate #Food

LabPlot

joined 2 years ago