515
you are viewing a single comment's thread
view the rest of the comments
view the rest of the comments
this post was submitted on 26 Sep 2024
515 points (94.5% liked)
Games
32180 readers
1078 users here now

Welcome to the largest gaming community on Lemmy! Discussion for all kinds of games. Video games, tabletop games, card games etc.
Weekly Threads:
Rules:
-
Submissions have to be related to games
-
No bigotry or harassment, be civil
-
No excessive self-promotion
-
Stay on-topic; no memes, funny videos, giveaways, reposts, or low-effort posts
-
Mark Spoilers and NSFW
-
No linking to piracy
More information about the community rules can be found here.
founded 1 year ago
MODERATORS
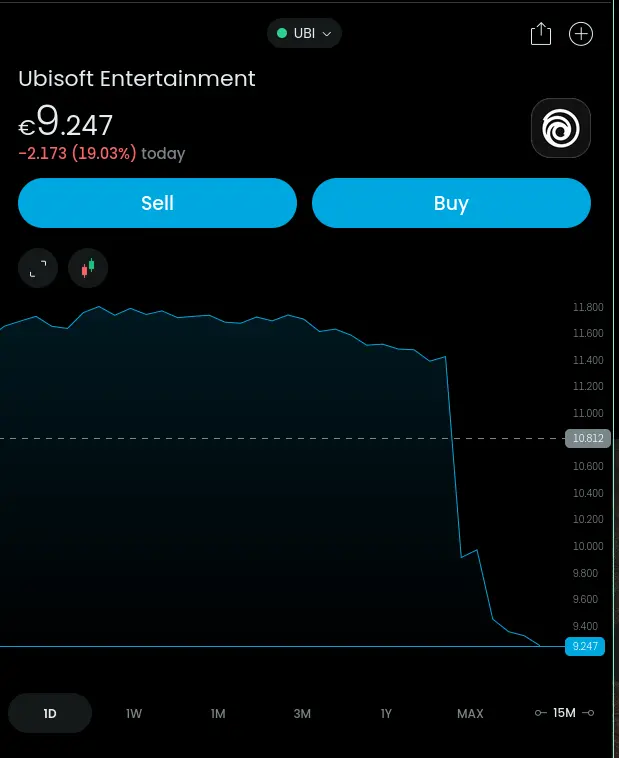
hm.. not quite.. but it certainly has seen some ups and downs, that are larger than what happened this morning. This is a graph of "all time"
It would be cool if these graphs could be inflation adjusted.
That's incredibly easy to do on any analysis platform.
Analysis schmanalysis
WSB detected :)
This thread is like a lesson in the importance of x and y axes range in time series plots